
| SDSS Classic |
| SDSS.org |
| SDSS4.org |
| SDSS3.org |
| SDSS Data |
| DR19 |
| DR17 |
| DR10 |
| DR7 |
| Science |
| Press Releases |
| Education |
| Image Gallery |
| Legacy Survey |
| SEGUE |
| Supernova Survey |
| Collaboration |
| Publications |
| Contact Us |
| Search |

Galaxy Wedge Plot
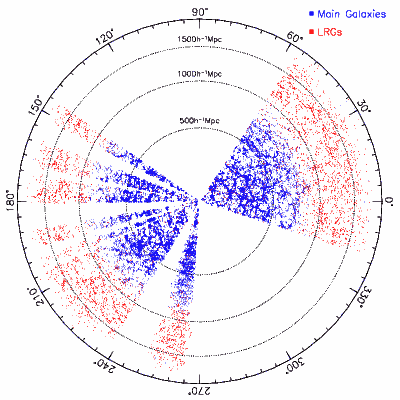
Each dot represents the location of one galaxy, with spectroscopically
measured redshift, from the SDSS Early Data Release. Blue dots are from
our main galaxy sample, and red dots are from our Luminous Red Galaxy
sample. All of the objects are near the celestial equator (declination
= 0). The location around the circle is determined by the object's
right ascension, and the distance from the center increases with the
object's redshift. The Main Galaxy population extends to a redshift of
0.2, and the Luminous Red Galaxy population extends to a redshift of
0.5.
Image credit: Chris Stoughton, SDSS Collaboration
This image is also available as a PostScript file (491 KB).